|
FY2018 House 1 |
FY2018 House Final |
FY2018 Senate Final |
FY2018 GAA |
|
|---|---|---|---|---|
| Budget Tracking | 1,661,961,313 | 1,701,048,734 | 1,701,048,734 | 1,683,153,734 |
|
FY2015 GAA |
FY2016 GAA |
FY2017 GAA |
FY2017 Projected |
FY2018 GAA |
|
|---|---|---|---|---|---|
| Historical Budget Levels | 1,391,500,896 | 1,596,665,738 | 1,637,028,930 | 1,604,686,855 | 1,683,153,734 |
* GAA is General Appropriation Act.
| SPENDING CATEGORY |
FY2014 Expended |
FY2015 Expended |
FY2016 Expended |
FY2017 Projected |
FY2018 GAA |
|---|---|---|---|---|---|
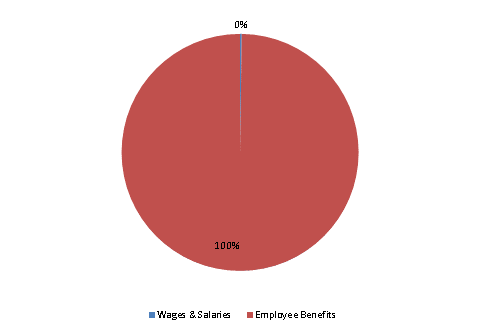
| Wages & Salaries | 2,206 | 2,192 | 2,501 | 2,140 | 3,750 |
| Employee Benefits | 1,336,488 | 1,578,777 | 1,566,011 | 1,602,547 | 1,679,404 |
| Operating Expenses | 0 | 0 | 112 | 0 | 0 |
| TOTAL | 1,338,693 | 1,580,969 | 1,568,624 | 1,604,687 | 1,683,154 |
FY2018 Spending Category Chart
