|
FY2018 House 1 |
FY2018 House Final |
FY2018 Senate Final |
FY2018 GAA |
|
|---|---|---|---|---|
| Budget Tracking | 8,881,074 | 8,881,074 | 8,881,074 | 8,881,074 |
|
FY2015 GAA |
FY2016 GAA |
FY2017 GAA |
FY2017 Projected |
FY2018 GAA |
|
|---|---|---|---|---|---|
| Historical Budget Levels | 16,500,000 | 15,127,415 | 8,770,634 | 7,707,622 | 8,881,074 |
* GAA is General Appropriation Act.
| SPENDING CATEGORY |
FY2014 Expended |
FY2015 Expended |
FY2016 Expended |
FY2017 Projected |
FY2018 GAA |
|---|---|---|---|---|---|
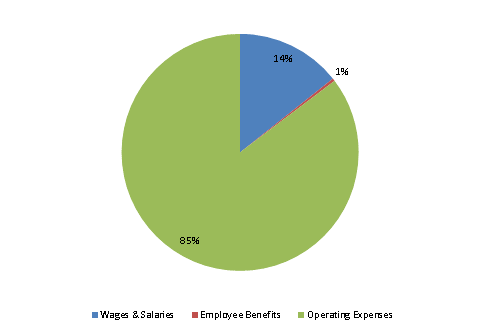
| Wages & Salaries | 1,437 | 1,929 | 814 | 1,122 | 1,271 |
| Employee Benefits | 22 | 35 | 14 | 34 | 33 |
| Operating Expenses | 13,379 | 8,962 | 6,375 | 6,552 | 7,577 |
| Grants & Subsidies | 56 | 34 | 0 | 0 | 0 |
| TOTAL | 14,894 | 10,959 | 7,202 | 7,708 | 8,881 |
FY2018 Spending Category Chart
