|
FY2018 House 1 |
FY2018 House Final |
FY2018 Senate Final |
FY2018 GAA |
|
|---|---|---|---|---|
| Budget Tracking | 9,191,075 | 9,160,033 | 8,606,075 | 8,347,893 |
|
FY2015 GAA |
FY2016 GAA |
FY2017 GAA |
FY2017 Projected |
FY2018 GAA |
|
|---|---|---|---|---|---|
| Historical Budget Levels | 13,689,943 | 11,205,654 | 9,897,930 | 8,891,159 | 8,347,893 |
* GAA is General Appropriation Act.
| SPENDING CATEGORY |
FY2014 Expended |
FY2015 Expended |
FY2016 Expended |
FY2017 Projected |
FY2018 GAA |
|---|---|---|---|---|---|
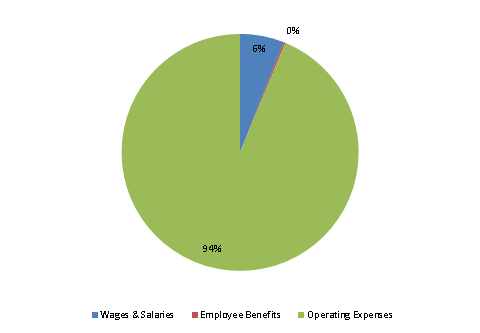
| Wages & Salaries | 1,269 | 1,663 | 1,191 | 716 | 499 |
| Employee Benefits | 19 | 29 | 21 | 31 | 22 |
| Operating Expenses | 8,159 | 8,651 | 8,564 | 8,145 | 7,828 |
| TOTAL | 9,447 | 10,342 | 9,775 | 8,891 | 8,348 |
FY2018 Spending Category Chart
