|
FY2018 House 1 |
FY2018 House Final |
FY2018 Senate Final |
FY2018 GAA |
|
|---|---|---|---|---|
| Budget Tracking | 141,922 | 141,921 | 143,346 | 141,921 |
|
FY2015 GAA |
FY2016 GAA |
FY2017 GAA |
FY2017 Projected |
FY2018 GAA |
|
|---|---|---|---|---|---|
| Historical Budget Levels | 140,021 | 142,386 | 142,386 | 132,634 | 141,921 |
* GAA is General Appropriation Act.
| SPENDING CATEGORY |
FY2014 Expended |
FY2015 Expended |
FY2016 Expended |
FY2017 Projected |
FY2018 GAA |
|---|---|---|---|---|---|
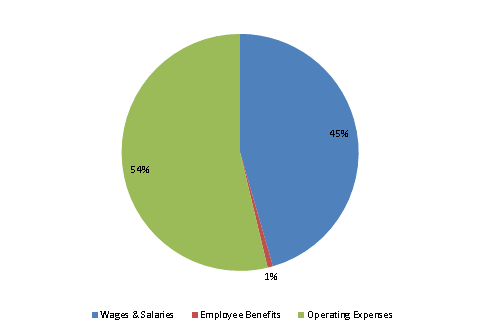
| Wages & Salaries | 65 | 49 | 58 | 55 | 65 |
| Employee Benefits | 1 | 1 | 1 | 1 | 1 |
| Operating Expenses | 59 | 79 | 71 | 76 | 76 |
| Debt Service | 0 | 0 | 0 | 0 | 0 |
| TOTAL | 125 | 130 | 130 | 133 | 142 |
FY2018 Spending Category Chart
