|
FY2018 House 1 |
FY2018 House Final |
FY2018 Senate Final |
FY2018 GAA |
|
|---|---|---|---|---|
| Budget Tracking | 29,963,755 | 29,963,755 | 29,113,755 | 28,877,049 |
|
FY2015 GAA |
FY2016 GAA |
FY2017 GAA |
FY2017 Projected |
FY2018 GAA |
|
|---|---|---|---|---|---|
| Historical Budget Levels | 34,891,260 | 32,359,861 | 30,400,957 | 29,887,137 | 28,877,049 |
* GAA is General Appropriation Act.
| SPENDING CATEGORY |
FY2014 Expended |
FY2015 Expended |
FY2016 Expended |
FY2017 Projected |
FY2018 GAA |
|---|---|---|---|---|---|
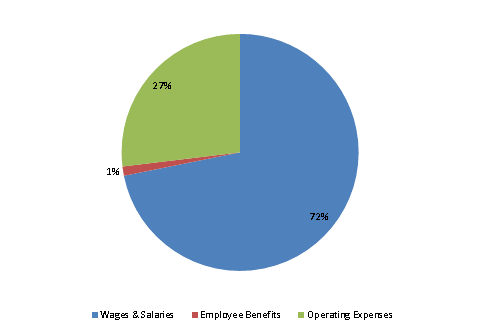
| Wages & Salaries | 22,491 | 23,835 | 21,815 | 21,412 | 20,744 |
| Employee Benefits | 329 | 394 | 369 | 373 | 364 |
| Operating Expenses | 8,558 | 7,725 | 8,766 | 8,102 | 7,770 |
| TOTAL | 31,379 | 31,954 | 30,950 | 29,887 | 28,877 |
FY2018 Spending Category Chart
