|
FY2018 House 1 |
FY2018 House Final |
FY2018 Senate Final |
FY2018 GAA |
|
|---|---|---|---|---|
| Budget Tracking | 3,048,657 | 3,048,656 | 3,433,199 | 2,957,196 |
|
FY2015 GAA |
FY2016 GAA |
FY2017 GAA |
FY2017 Projected |
FY2018 GAA |
|
|---|---|---|---|---|---|
| Historical Budget Levels | 2,818,237 | 2,767,791 | 3,048,657 | 3,040,510 | 2,957,196 |
* GAA is General Appropriation Act.
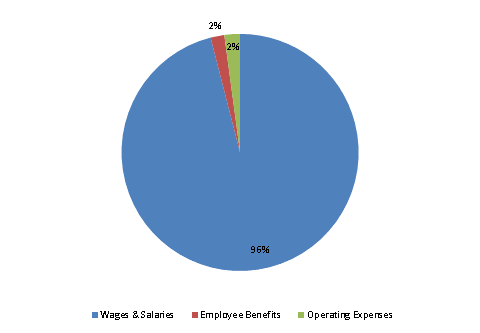
| SPENDING CATEGORY |
FY2014 Expended |
FY2015 Expended |
FY2016 Expended |
FY2017 Projected |
FY2018 GAA |
|---|---|---|---|---|---|
| Wages & Salaries | 2,356 | 2,557 | 2,689 | 2,816 | 2,839 |
| Employee Benefits | 42 | 51 | 53 | 56 | 56 |
| Operating Expenses | 170 | 158 | 153 | 168 | 63 |
| TOTAL | 2,567 | 2,767 | 2,894 | 3,041 | 2,957 |
FY2018 Spending Category Chart