|
FY2018 House 1 |
FY2018 House Final |
FY2018 Senate Final |
FY2018 GAA |
|
|---|---|---|---|---|
| Budget Tracking | 1,602,058 | 1,647,058 | 1,633,781 | 1,617,919 |
|
FY2015 GAA |
FY2016 GAA |
FY2017 GAA |
FY2017 Projected |
FY2018 GAA |
|
|---|---|---|---|---|---|
| Historical Budget Levels | 1,486,196 | 1,459,594 | 1,586,196 | 1,519,559 | 1,617,919 |
* GAA is General Appropriation Act.
| SPENDING CATEGORY |
FY2014 Expended |
FY2015 Expended |
FY2016 Expended |
FY2017 Projected |
FY2018 GAA |
|---|---|---|---|---|---|
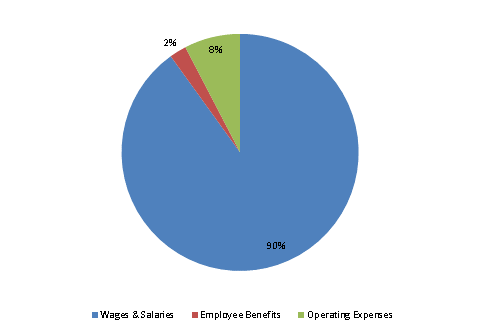
| Wages & Salaries | 1,192 | 1,304 | 1,381 | 1,386 | 1,457 |
| Employee Benefits | 34 | 29 | 30 | 36 | 37 |
| Operating Expenses | 143 | 100 | 105 | 97 | 124 |
| TOTAL | 1,369 | 1,433 | 1,516 | 1,520 | 1,618 |
FY2018 Spending Category Chart
