|
FY2018 House 1 |
FY2018 House Final |
FY2018 Senate Final |
FY2018 GAA |
|
|---|---|---|---|---|
| Budget Tracking | 399,960 | 475,000 | 450,000 | 449,980 |
|
FY2015 GAA |
FY2016 GAA |
FY2017 GAA |
FY2017 Projected |
FY2018 GAA |
|
|---|---|---|---|---|---|
| Historical Budget Levels | 350,000 | 343,735 | 396,000 | 395,452 | 449,980 |
* GAA is General Appropriation Act.
| SPENDING CATEGORY |
FY2014 Expended |
FY2015 Expended |
FY2016 Expended |
FY2017 Projected |
FY2018 GAA |
|---|---|---|---|---|---|
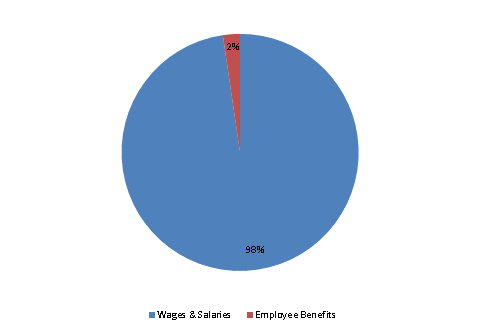
| Wages & Salaries | 264 | 328 | 359 | 384 | 440 |
| Employee Benefits | 4 | 6 | 8 | 12 | 10 |
| Operating Expenses | 81 | 9 | 32 | 0 | 0 |
| TOTAL | 349 | 343 | 400 | 395 | 450 |
FY2018 Spending Category Chart
