|
FY2018 House 1 |
FY2018 House Final |
FY2018 Senate Final |
FY2018 GAA |
|
|---|---|---|---|---|
| Budget Tracking | 1,510,847 | 1,473,854 | 1,473,855 | 1,473,854 |
|
FY2015 GAA |
FY2016 GAA |
FY2017 GAA |
FY2017 Projected |
FY2018 GAA |
|
|---|---|---|---|---|---|
| Historical Budget Levels | 1,500,717 | 1,473,854 | 1,473,854 | 1,366,327 | 1,473,854 |
* GAA is General Appropriation Act.
| SPENDING CATEGORY |
FY2014 Expended |
FY2015 Expended |
FY2016 Expended |
FY2017 Projected |
FY2018 GAA |
|---|---|---|---|---|---|
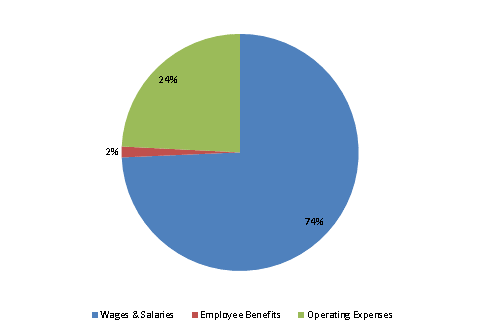
| Wages & Salaries | 1,055 | 1,043 | 1,038 | 1,015 | 1,095 |
| Employee Benefits | 18 | 17 | 18 | 22 | 22 |
| Operating Expenses | 333 | 302 | 336 | 329 | 357 |
| TOTAL | 1,407 | 1,362 | 1,392 | 1,366 | 1,474 |
FY2018 Spending Category Chart
