|
FY2018 House 1 |
FY2018 House Final |
FY2018 Senate Final |
FY2018 GAA |
|
|---|---|---|---|---|
| Budget Tracking | 3,830,618 | 3,907,371 | 3,907,371 | 3,830,618 |
|
FY2015 GAA |
FY2016 GAA |
FY2017 GAA |
FY2017 Projected |
FY2018 GAA |
|
|---|---|---|---|---|---|
| Historical Budget Levels | 3,532,371 | 3,694,142 | 3,757,371 | 3,726,524 | 3,830,618 |
* GAA is General Appropriation Act.
| SPENDING CATEGORY |
FY2014 Expended |
FY2015 Expended |
FY2016 Expended |
FY2017 Projected |
FY2018 GAA |
|---|---|---|---|---|---|
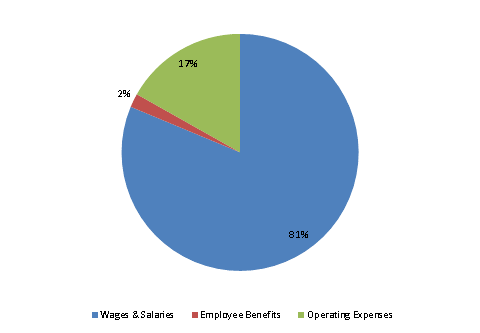
| Wages & Salaries | 2,768 | 2,795 | 2,961 | 3,072 | 3,114 |
| Employee Benefits | 55 | 67 | 71 | 72 | 72 |
| Operating Expenses | 552 | 475 | 658 | 582 | 645 |
| TOTAL | 3,375 | 3,337 | 3,690 | 3,727 | 3,831 |
FY2018 Spending Category Chart
