|
FY2018 House 1 |
FY2018 House Final |
FY2018 Senate Final |
FY2018 GAA |
|
|---|---|---|---|---|
| Budget Tracking | 4,225,870 | 4,169,880 | 4,169,880 | 4,169,880 |
|
FY2015 GAA |
FY2016 GAA |
FY2017 GAA |
FY2017 Projected |
FY2018 GAA |
|
|---|---|---|---|---|---|
| Historical Budget Levels | 4,033,878 | 3,961,672 | 4,169,880 | 3,899,080 | 4,169,880 |
* GAA is General Appropriation Act.
| SPENDING CATEGORY |
FY2014 Expended |
FY2015 Expended |
FY2016 Expended |
FY2017 Projected |
FY2018 GAA |
|---|---|---|---|---|---|
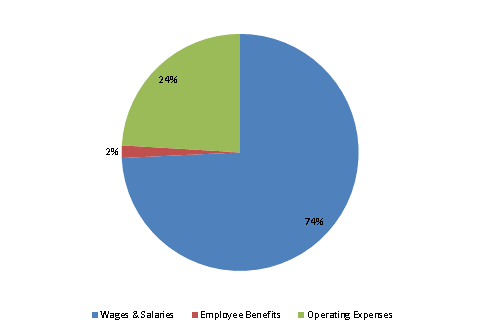
| Wages & Salaries | 2,855 | 2,820 | 2,864 | 2,867 | 3,096 |
| Employee Benefits | 61 | 71 | 67 | 72 | 71 |
| Operating Expenses | 897 | 939 | 956 | 961 | 1,003 |
| TOTAL | 3,813 | 3,830 | 3,888 | 3,899 | 4,170 |
FY2018 Spending Category Chart
