|
FY2018 House 1 |
FY2018 House Final |
FY2018 Senate Final |
FY2018 GAA |
|
|---|---|---|---|---|
| Budget Tracking | 14,307,229 | 12,075,699 | 16,525,000 | 13,950,699 |
|
FY2015 GAA |
FY2016 GAA |
FY2017 GAA |
FY2017 Projected |
FY2018 GAA |
|
|---|---|---|---|---|---|
| Historical Budget Levels | 12,000,000 | 11,785,201 | 14,299,000 | 14,299,000 | 13,950,699 |
* GAA is General Appropriation Act.
| SPENDING CATEGORY |
FY2014 Expended |
FY2015 Expended |
FY2016 Expended |
FY2017 Projected |
FY2018 GAA |
|---|---|---|---|---|---|
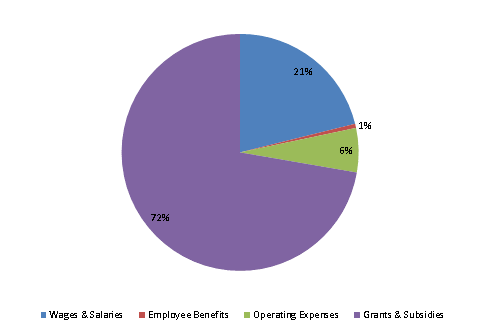
| Wages & Salaries | 2,004 | 2,011 | 2,293 | 2,668 | 2,947 |
| Employee Benefits | 61 | 64 | 76 | 78 | 79 |
| Operating Expenses | 553 | 671 | 983 | 864 | 842 |
| Grants & Subsidies | 5,462 | 9,033 | 10,805 | 10,689 | 10,083 |
| TOTAL | 8,080 | 11,779 | 14,157 | 14,299 | 13,951 |
FY2018 Spending Category Chart
