|
FY2018 House 1 |
FY2018 House Final |
FY2018 Senate Final |
FY2018 GAA |
|
|---|---|---|---|---|
| Budget Tracking | 81,964,789 | 81,964,789 | 81,964,789 | 81,744,402 |
|
FY2015 GAA |
FY2016 GAA |
FY2017 GAA |
FY2017 Projected |
FY2018 GAA |
|
|---|---|---|---|---|---|
| Historical Budget Levels | 82,823,864 | 81,510,864 | 81,144,402 | 78,171,180 | 81,744,402 |
* GAA is General Appropriation Act.
| SPENDING CATEGORY |
FY2014 Expended |
FY2015 Expended |
FY2016 Expended |
FY2017 Projected |
FY2018 GAA |
|---|---|---|---|---|---|
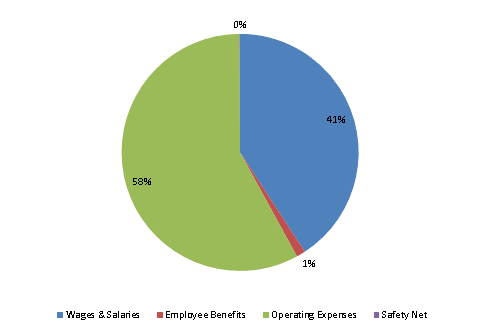
| Wages & Salaries | 30,297 | 31,266 | 32,678 | 33,608 | 33,359 |
| Employee Benefits | 659 | 950 | 974 | 976 | 1,000 |
| Operating Expenses | 48,203 | 49,043 | 48,561 | 43,522 | 47,320 |
| Safety Net | 137 | 88 | 65 | 66 | 66 |
| TOTAL | 79,296 | 81,347 | 82,278 | 78,171 | 81,744 |
FY2018 Spending Category Chart
