|
FY2018 House 1 |
FY2018 House Final |
FY2018 Senate Final |
FY2018 GAA |
|
|---|---|---|---|---|
| Budget Tracking | 2,388,092 | 2,488,091 | 2,911,971 | 2,438,091 |
|
FY2015 GAA |
FY2016 GAA |
FY2017 GAA |
FY2017 Projected |
FY2018 GAA |
|
|---|---|---|---|---|---|
| Historical Budget Levels | 2,312,772 | 2,271,489 | 2,271,489 | 2,264,289 | 2,438,091 |
* GAA is General Appropriation Act.
| SPENDING CATEGORY |
FY2014 Expended |
FY2015 Expended |
FY2016 Expended |
FY2017 Projected |
FY2018 GAA |
|---|---|---|---|---|---|
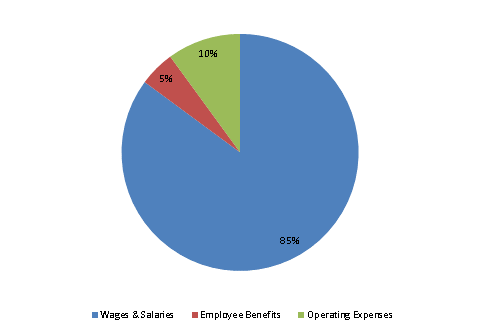
| Wages & Salaries | 1,773 | 1,955 | 2,061 | 2,041 | 2,075 |
| Employee Benefits | 121 | 122 | 94 | 116 | 119 |
| Operating Expenses | 359 | 165 | 185 | 107 | 244 |
| TOTAL | 2,253 | 2,242 | 2,340 | 2,264 | 2,438 |
FY2018 Spending Category Chart
