|
FY2018 House 1 |
FY2018 House Final |
FY2018 Senate Final |
FY2018 GAA |
|
|---|---|---|---|---|
| Budget Tracking | 1,752,422 | 1,752,422 | 1,752,422 | 1,752,422 |
|
FY2015 GAA |
FY2016 GAA |
FY2017 GAA |
FY2017 Projected |
FY2018 GAA |
|
|---|---|---|---|---|---|
| Historical Budget Levels | 1,767,667 | 1,752,598 | 1,735,072 | 1,715,580 | 1,752,422 |
* GAA is General Appropriation Act.
| SPENDING CATEGORY |
FY2014 Expended |
FY2015 Expended |
FY2016 Expended |
FY2017 Projected |
FY2018 GAA |
|---|---|---|---|---|---|
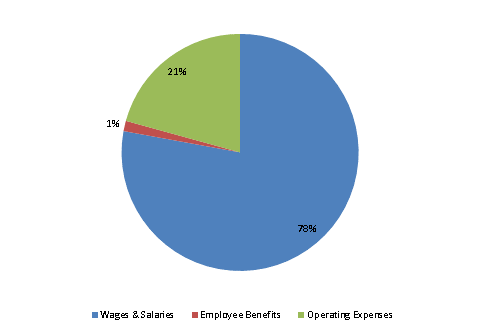
| Wages & Salaries | 1,258 | 1,339 | 1,398 | 1,467 | 1,365 |
| Employee Benefits | 19 | 23 | 25 | 26 | 25 |
| Operating Expenses | 400 | 403 | 324 | 222 | 363 |
| TOTAL | 1,677 | 1,765 | 1,746 | 1,716 | 1,752 |
FY2018 Spending Category Chart
