|
FY2018 House 1 |
FY2018 House Final |
FY2018 Senate Final |
FY2018 GAA |
|
|---|---|---|---|---|
| Budget Tracking | 932,724 | 932,724 | 1,032,724 | 982,724 |
|
FY2015 GAA |
FY2016 GAA |
FY2017 GAA |
FY2017 Projected |
FY2018 GAA |
|
|---|---|---|---|---|---|
| Historical Budget Levels | 916,000 | 799,695 | 932,724 | 924,140 | 982,724 |
* GAA is General Appropriation Act.
| SPENDING CATEGORY |
FY2014 Expended |
FY2015 Expended |
FY2016 Expended |
FY2017 Projected |
FY2018 GAA |
|---|---|---|---|---|---|
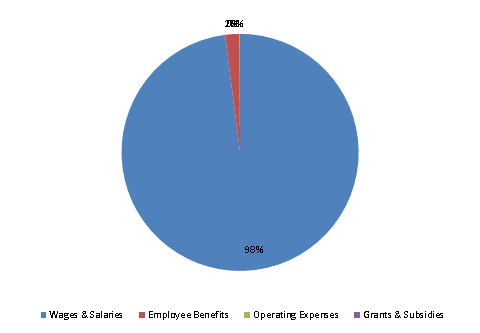
| Wages & Salaries | 723 | 721 | 917 | 902 | 963 |
| Employee Benefits | 12 | 15 | 18 | 22 | 19 |
| Operating Expenses | 10 | 74 | 1 | 0 | 0 |
| Grants & Subsidies | 50 | 100 | 185 | 0 | 0 |
| TOTAL | 795 | 911 | 1,121 | 924 | 983 |
FY2018 Spending Category Chart
