|
FY2018 House 1 |
FY2018 House Final |
FY2018 Senate Final |
FY2018 GAA |
|
|---|---|---|---|---|
| Budget Tracking | 5,596,151 | 5,596,151 | 5,596,151 | 5,596,151 |
|
FY2015 GAA |
FY2016 GAA |
FY2017 GAA |
FY2017 Projected |
FY2018 GAA |
|
|---|---|---|---|---|---|
| Historical Budget Levels | 9,881,600 | 5,700,000 | 11,700,000 | 11,433,363 | 5,596,151 |
* GAA is General Appropriation Act.
| SPENDING CATEGORY |
FY2014 Expended |
FY2015 Expended |
FY2016 Expended |
FY2017 Projected |
FY2018 GAA |
|---|---|---|---|---|---|
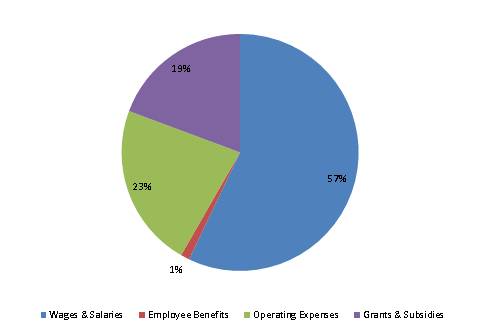
| Wages & Salaries | 2,762 | 3,091 | 3,206 | 2,408 | 3,195 |
| Employee Benefits | 49 | 53 | 68 | 135 | 67 |
| Operating Expenses | 3,039 | 5,164 | 3,237 | 7,045 | 1,252 |
| Grants & Subsidies | 7,684 | 1,815 | 1,082 | 1,845 | 1,082 |
| TOTAL | 13,534 | 10,122 | 7,592 | 11,433 | 5,596 |
FY2018 Spending Category Chart
