|
FY2018 House 1 |
FY2018 House Final |
FY2018 Senate Final |
FY2018 GAA |
|
|---|---|---|---|---|
| Budget Tracking | 6,382,462 | 6,532,422 | 6,669,269 | 6,457,442 |
|
FY2015 GAA |
FY2016 GAA |
FY2017 GAA |
FY2017 Projected |
FY2018 GAA |
|
|---|---|---|---|---|---|
| Historical Budget Levels | 6,214,549 | 6,103,930 | 6,319,269 | 6,289,157 | 6,457,442 |
* GAA is General Appropriation Act.
| SPENDING CATEGORY |
FY2014 Expended |
FY2015 Expended |
FY2016 Expended |
FY2017 Projected |
FY2018 GAA |
|---|---|---|---|---|---|
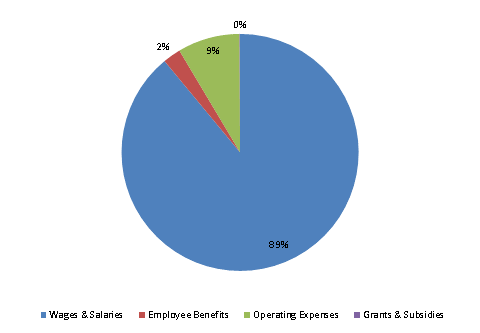
| Wages & Salaries | 5,117 | 5,574 | 5,644 | 5,542 | 5,747 |
| Employee Benefits | 118 | 128 | 157 | 125 | 158 |
| Operating Expenses | 689 | 481 | 541 | 623 | 547 |
| Grants & Subsidies | 5 | 5 | 5 | 0 | 5 |
| TOTAL | 5,930 | 6,188 | 6,346 | 6,289 | 6,457 |
FY2018 Spending Category Chart
