|
FY2018 House 1 |
FY2018 House Final |
FY2018 Senate Final |
FY2018 GAA |
|
|---|---|---|---|---|
| Budget Tracking | 1,779,118 | 1,779,118 | 1,779,118 | 1,725,744 |
|
FY2015 GAA |
FY2016 GAA |
FY2017 GAA |
FY2017 Projected |
FY2018 GAA |
|
|---|---|---|---|---|---|
| Historical Budget Levels | 1,317,090 | 1,317,090 | 1,779,118 | 1,762,747 | 1,725,744 |
* GAA is General Appropriation Act.
| SPENDING CATEGORY |
FY2014 Expended |
FY2015 Expended |
FY2016 Expended |
FY2017 Projected |
FY2018 GAA |
|---|---|---|---|---|---|
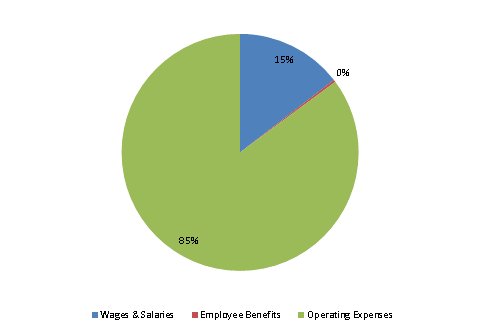
| Wages & Salaries | 257 | 261 | 258 | 259 | 251 |
| Employee Benefits | 4 | 4 | 4 | 6 | 5 |
| Operating Expenses | 1,056 | 1,028 | 1,522 | 1,499 | 1,470 |
| TOTAL | 1,317 | 1,293 | 1,784 | 1,763 | 1,726 |
FY2018 Spending Category Chart
