|
FY2018 House 1 |
FY2018 House Final |
FY2018 Senate Final |
FY2018 GAA |
|
|---|---|---|---|---|
| Budget Tracking | 4,290,813 | 4,429,280 | 4,290,813 | 4,254,587 |
|
FY2015 GAA |
FY2016 GAA |
FY2017 GAA |
FY2017 Projected |
FY2018 GAA |
|
|---|---|---|---|---|---|
| Historical Budget Levels | 3,988,801 | 3,988,801 | 4,218,362 | 4,218,362 | 4,254,587 |
* GAA is General Appropriation Act.
| SPENDING CATEGORY |
FY2014 Expended |
FY2015 Expended |
FY2016 Expended |
FY2017 Projected |
FY2018 GAA |
|---|---|---|---|---|---|
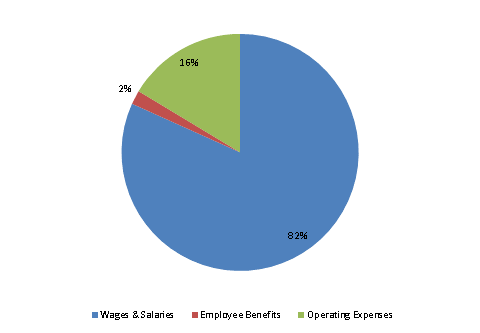
| Wages & Salaries | 3,102 | 3,164 | 3,274 | 3,434 | 3,477 |
| Employee Benefits | 63 | 80 | 76 | 82 | 81 |
| Operating Expenses | 649 | 702 | 685 | 702 | 696 |
| TOTAL | 3,813 | 3,946 | 4,035 | 4,218 | 4,255 |
FY2018 Spending Category Chart
