|
FY2018 House 1 |
FY2018 House Final |
FY2018 Senate Final |
FY2018 GAA |
|
|---|---|---|---|---|
| Budget Tracking | 9,007,869 | 9,283,328 | 9,007,869 | 8,924,567 |
|
FY2015 GAA |
FY2016 GAA |
FY2017 GAA |
FY2017 Projected |
FY2018 GAA |
|
|---|---|---|---|---|---|
| Historical Budget Levels | 7,811,227 | 7,811,226 | 8,841,265 | 8,841,266 | 8,924,567 |
* GAA is General Appropriation Act.
| SPENDING CATEGORY |
FY2014 Expended |
FY2015 Expended |
FY2016 Expended |
FY2017 Projected |
FY2018 GAA |
|---|---|---|---|---|---|
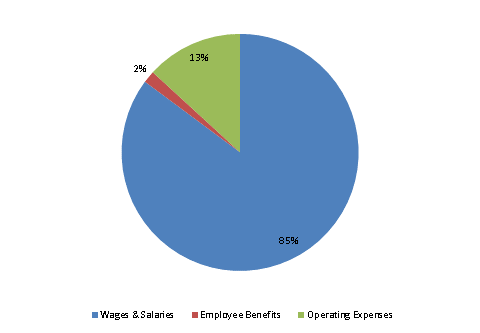
| Wages & Salaries | 6,707 | 6,843 | 7,036 | 7,684 | 7,601 |
| Employee Benefits | 112 | 123 | 137 | 144 | 147 |
| Operating Expenses | 661 | 744 | 728 | 1,013 | 1,177 |
| TOTAL | 7,480 | 7,709 | 7,900 | 8,841 | 8,925 |
FY2018 Spending Category Chart
