|
FY2018 House 1 |
FY2018 House Final |
FY2018 Senate Final |
FY2018 GAA |
|
|---|---|---|---|---|
| Budget Tracking | 9,768,422 | 10,071,381 | 9,768,422 | 9,680,106 |
|
FY2015 GAA |
FY2016 GAA |
FY2017 GAA |
FY2017 Projected |
FY2018 GAA |
|
|---|---|---|---|---|---|
| Historical Budget Levels | 8,998,569 | 8,998,569 | 9,591,791 | 9,591,791 | 9,680,106 |
* GAA is General Appropriation Act.
| SPENDING CATEGORY |
FY2014 Expended |
FY2015 Expended |
FY2016 Expended |
FY2017 Projected |
FY2018 GAA |
|---|---|---|---|---|---|
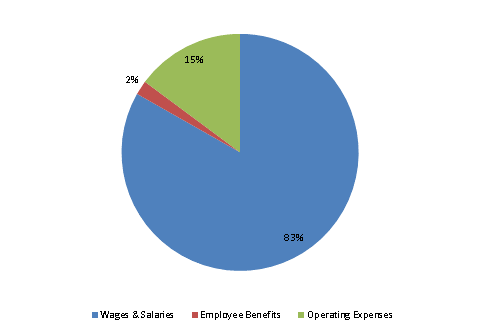
| Wages & Salaries | 7,050 | 7,409 | 7,588 | 8,007 | 8,055 |
| Employee Benefits | 134 | 153 | 161 | 185 | 188 |
| Operating Expenses | 1,446 | 1,351 | 1,352 | 1,400 | 1,437 |
| TOTAL | 8,630 | 8,912 | 9,101 | 9,592 | 9,680 |
FY2018 Spending Category Chart
