|
FY2018 House 1 |
FY2018 House Final |
FY2018 Senate Final |
FY2018 GAA |
|
|---|---|---|---|---|
| Budget Tracking | 9,676,289 | 10,226,910 | 9,676,289 | 9,589,054 |
|
FY2015 GAA |
FY2016 GAA |
FY2017 GAA |
FY2017 Projected |
FY2018 GAA |
|
|---|---|---|---|---|---|
| Historical Budget Levels | 8,785,700 | 8,785,700 | 9,501,819 | 9,501,819 | 9,589,054 |
* GAA is General Appropriation Act.
| SPENDING CATEGORY |
FY2014 Expended |
FY2015 Expended |
FY2016 Expended |
FY2017 Projected |
FY2018 GAA |
|---|---|---|---|---|---|
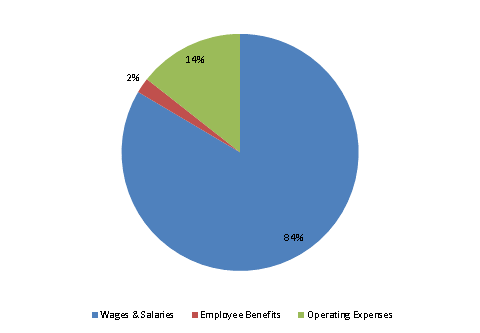
| Wages & Salaries | 7,359 | 7,326 | 7,384 | 7,864 | 8,007 |
| Employee Benefits | 156 | 163 | 168 | 199 | 200 |
| Operating Expenses | 1,042 | 1,223 | 1,331 | 1,440 | 1,382 |
| TOTAL | 8,557 | 8,712 | 8,883 | 9,502 | 9,589 |
FY2018 Spending Category Chart
