|
FY2018 House 1 |
FY2018 House Final |
FY2018 Senate Final |
FY2018 GAA |
|
|---|---|---|---|---|
| Budget Tracking | 19,290,288 | 19,862,842 | 19,290,288 | 19,103,640 |
|
FY2015 GAA |
FY2016 GAA |
FY2017 GAA |
FY2017 Projected |
FY2018 GAA |
|
|---|---|---|---|---|---|
| Historical Budget Levels | 17,597,589 | 17,597,589 | 18,916,992 | 18,915,920 | 19,103,640 |
* GAA is General Appropriation Act.
| SPENDING CATEGORY |
FY2014 Expended |
FY2015 Expended |
FY2016 Expended |
FY2017 Projected |
FY2018 GAA |
|---|---|---|---|---|---|
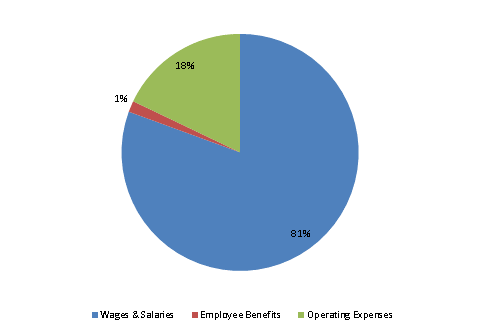
| Wages & Salaries | 13,685 | 13,844 | 14,507 | 15,164 | 15,393 |
| Employee Benefits | 234 | 260 | 280 | 296 | 291 |
| Operating Expenses | 2,976 | 3,263 | 3,012 | 3,454 | 3,420 |
| Debt Service | 0 | 0 | 0 | 3 | 0 |
| TOTAL | 16,895 | 17,367 | 17,799 | 18,916 | 19,104 |
FY2018 Spending Category Chart
