|
FY2018 House 1 |
FY2018 House Final |
FY2018 Senate Final |
FY2018 GAA |
|
|---|---|---|---|---|
| Budget Tracking | 30,900,169 | 30,900,169 | 30,340,165 | 30,340,165 |
|
FY2015 GAA |
FY2016 GAA |
FY2017 GAA |
FY2017 Projected |
FY2018 GAA |
|
|---|---|---|---|---|---|
| Historical Budget Levels | 28,525,137 | 28,306,204 | 29,248,259 | 30,579,227 | 30,340,165 |
* GAA is General Appropriation Act.
| SPENDING CATEGORY |
FY2014 Expended |
FY2015 Expended |
FY2016 Expended |
FY2017 Projected |
FY2018 GAA |
|---|---|---|---|---|---|
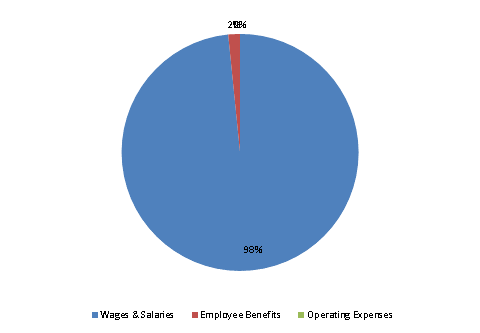
| Wages & Salaries | 27,506 | 28,563 | 29,377 | 30,077 | 29,853 |
| Employee Benefits | 390 | 454 | 485 | 500 | 485 |
| Operating Expenses | 2 | 2 | 2 | 3 | 2 |
| TOTAL | 27,899 | 29,020 | 29,864 | 30,579 | 30,340 |
FY2018 Spending Category Chart
