|
FY2018 House 1 |
FY2018 House Final |
FY2018 Senate Final |
FY2018 GAA |
|
|---|---|---|---|---|
| Budget Tracking | 69,922,810 | 69,722,810 | 69,029,761 | 69,029,761 |
|
FY2015 GAA |
FY2016 GAA |
FY2017 GAA |
FY2017 Projected |
FY2018 GAA |
|
|---|---|---|---|---|---|
| Historical Budget Levels | 63,028,051 | 62,485,236 | 66,054,290 | 69,203,005 | 69,029,761 |
* GAA is General Appropriation Act.
| SPENDING CATEGORY |
FY2014 Expended |
FY2015 Expended |
FY2016 Expended |
FY2017 Projected |
FY2018 GAA |
|---|---|---|---|---|---|
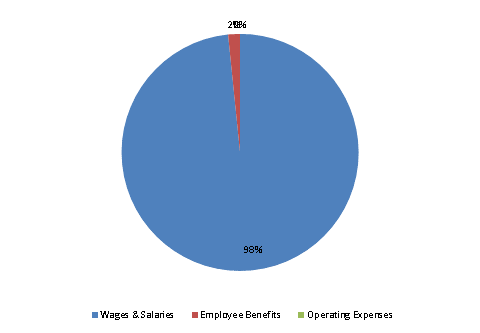
| Wages & Salaries | 60,541 | 65,061 | 66,252 | 68,070 | 67,911 |
| Employee Benefits | 860 | 1,034 | 1,093 | 1,130 | 1,116 |
| Operating Expenses | 2 | 2 | 2 | 3 | 3 |
| TOTAL | 61,403 | 66,098 | 67,347 | 69,203 | 69,030 |
FY2018 Spending Category Chart
