|
FY2018 House 1 |
FY2018 House Final |
FY2018 Senate Final |
FY2018 GAA |
|
|---|---|---|---|---|
| Budget Tracking | 3,261,947 | 3,261,947 | 3,232,881 | 3,232,881 |
|
FY2015 GAA |
FY2016 GAA |
FY2017 GAA |
FY2017 Projected |
FY2018 GAA |
|
|---|---|---|---|---|---|
| Historical Budget Levels | 3,000,000 | 2,936,718 | 3,229,651 | 3,229,651 | 3,232,881 |
* GAA is General Appropriation Act.
| SPENDING CATEGORY |
FY2014 Expended |
FY2015 Expended |
FY2016 Expended |
FY2017 Projected |
FY2018 GAA |
|---|---|---|---|---|---|
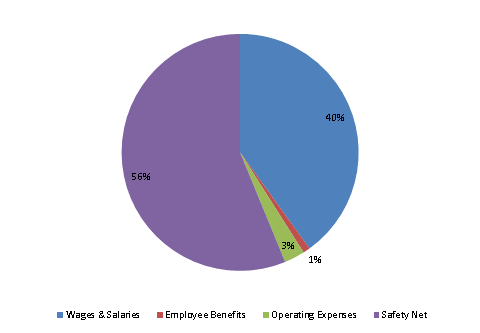
| Wages & Salaries | 0 | 730 | 1,580 | 1,274 | 1,295 |
| Employee Benefits | 0 | 16 | 28 | 31 | 31 |
| Operating Expenses | 0 | 89 | 111 | 91 | 91 |
| Safety Net | 0 | 878 | 1,243 | 1,833 | 1,817 |
| TOTAL | 0 | 1,713 | 2,962 | 3,230 | 3,233 |
FY2018 Spending Category Chart
