|
FY2018 House 1 |
FY2018 House Final |
FY2018 Senate Final |
FY2018 GAA |
|
|---|---|---|---|---|
| Budget Tracking | 12,793,913 | 13,640,841 | 13,640,841 | 13,217,377 |
|
FY2015 GAA |
FY2016 GAA |
FY2017 GAA |
FY2017 Projected |
FY2018 GAA |
|
|---|---|---|---|---|---|
| Historical Budget Levels | 12,626,326 | 12,359,985 | 13,107,764 | 12,689,412 | 13,217,377 |
* GAA is General Appropriation Act.
| SPENDING CATEGORY |
FY2014 Expended |
FY2015 Expended |
FY2016 Expended |
FY2017 Projected |
FY2018 GAA |
|---|---|---|---|---|---|
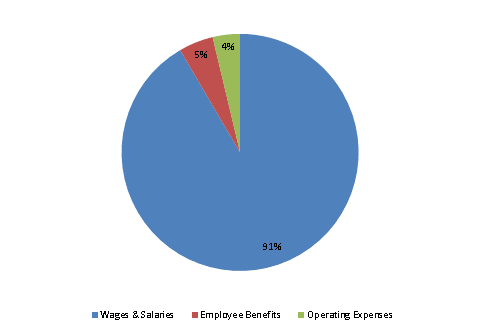
| Wages & Salaries | 10,982 | 11,628 | 11,291 | 11,727 | 12,103 |
| Employee Benefits | 341 | 427 | 433 | 504 | 622 |
| Operating Expenses | 723 | 438 | 780 | 458 | 493 |
| TOTAL | 12,046 | 12,493 | 12,504 | 12,689 | 13,217 |
FY2018 Spending Category Chart
