|
FY2018 House 1 |
FY2018 House Final |
FY2018 Senate Final |
FY2018 GAA |
|
|---|---|---|---|---|
| Budget Tracking | 23,189,970 | 14,951,982 | 20,189,970 | 14,951,982 |
|
FY2015 GAA |
FY2016 GAA |
FY2017 GAA |
FY2017 Projected |
FY2018 GAA |
|
|---|---|---|---|---|---|
| Historical Budget Levels | 15,274,176 | 14,951,982 | 14,951,982 | 23,171,806 | 14,951,982 |
* GAA is General Appropriation Act.
| SPENDING CATEGORY |
FY2014 Expended |
FY2015 Expended |
FY2016 Expended |
FY2017 Projected |
FY2018 GAA |
|---|---|---|---|---|---|
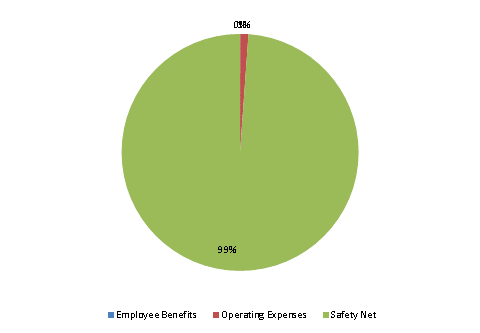
| Employee Benefits | 5 | 2 | 4 | 5 | 3 |
| Operating Expenses | 245 | 242 | 296 | 258 | 166 |
| Safety Net | 16,587 | 15,030 | 18,252 | 22,909 | 14,782 |
| TOTAL | 16,837 | 15,274 | 18,552 | 23,172 | 14,952 |
FY2018 Spending Category Chart
