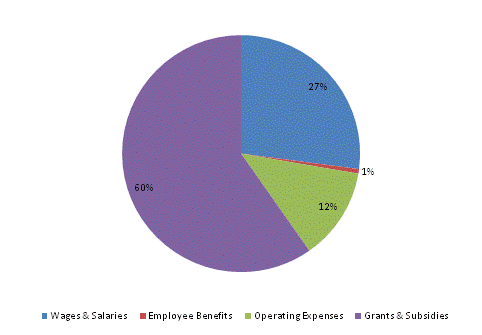
| SPENDING CATEGORY |
FY2013 Expended |
FY2014 Expended |
FY2015 Expended |
FY2016 Projected |
FY2017 GAA |
|---|---|---|---|---|---|
| Wages & Salaries | 1,643 | 1,727 | 2,529 | 3,359 | 3,798 |
| Employee Benefits | 30 | 31 | 47 | 77 | 87 |
| Operating Expenses | 1,530 | 1,685 | 1,570 | 1,855 | 1,763 |
| Grants & Subsidies | 1,062 | 14,826 | 21,105 | 10,935 | 8,383 |
| TOTAL | 4,266 | 18,269 | 25,251 | 16,226 | 14,031 |
FY2017 Spending Category Chart
