| SPENDING CATEGORY |
FY2013 Expended |
FY2014 Expended |
FY2015 Expended |
FY2016 Projected |
FY2017 GAA |
|---|---|---|---|---|---|
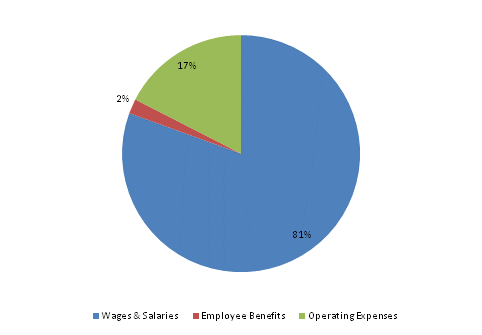
| Wages & Salaries | 1,103 | 1,177 | 1,395 | 1,032 | 1,290 |
| Employee Benefits | 23 | 25 | 32 | 34 | 32 |
| Operating Expenses | 218 | 359 | 411 | 271 | 280 |
| TOTAL | 1,344 | 1,561 | 1,838 | 1,338 | 1,601 |
FY2017 Spending Category Chart
