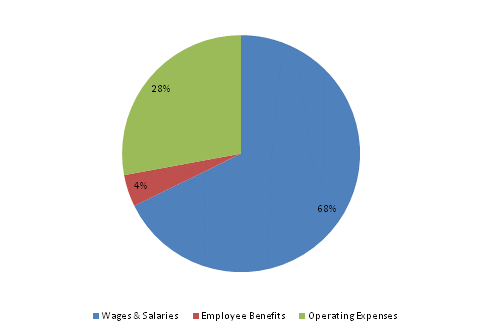
| SPENDING CATEGORY |
FY2013 Expended |
FY2014 Expended |
FY2015 Expended |
FY2016 Projected |
FY2017 GAA |
|---|---|---|---|---|---|
| Wages & Salaries | 47 | 45 | 56 | 68 | 79 |
| Employee Benefits | 1 | 1 | 6 | 4 | 5 |
| Operating Expenses | 21 | 25 | 31 | 28 | 32 |
| TOTAL | 69 | 71 | 94 | 101 | 116 |
FY2017 Spending Category Chart