|
FY2017 House 1 |
FY2017 House Final |
FY2017 Senate Final |
FY2017 GAA |
|
|---|---|---|---|---|
| Budget Tracking | 7,889,141 | 7,391,120 | 7,696,098 | 7,691,120 |
|
FY2014 GAA |
FY2015 GAA |
FY2016 GAA |
FY2016 Projected |
FY2017 GAA |
|
|---|---|---|---|---|---|
| Historical Budget Levels | 7,890,268 | 8,256,297 | 17,483,679 | 8,399,141 | 7,691,120 |
* GAA is General Appropriation Act.
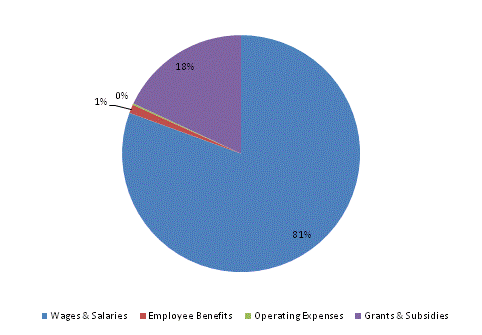
| SPENDING CATEGORY |
FY2013 Expended |
FY2014 Expended |
FY2015 Expended |
FY2016 Projected |
FY2017 GAA |
|---|---|---|---|---|---|
| Wages & Salaries | 6,284 | 6,187 | 6,572 | 6,356 | 6,197 |
| Employee Benefits | 71 | 78 | 92 | 92 | 90 |
| Operating Expenses | 21 | 10 | 10 | 16 | 16 |
| Grants & Subsidies | 1,661 | 1,439 | 1,567 | 1,934 | 1,388 |
| TOTAL | 8,037 | 7,713 | 8,241 | 8,399 | 7,691 |
FY2017 Spending Category Chart