|
FY2017 House 1 |
FY2017 House Final |
FY2017 Senate Final |
FY2017 GAA |
|
|---|---|---|---|---|
| Budget Tracking | 30,274,867 | 29,318,517 | 31,074,866 | 29,468,517 |
|
FY2014 GAA |
FY2015 GAA |
FY2016 GAA |
FY2016 Projected |
FY2017 GAA |
|
|---|---|---|---|---|---|
| Historical Budget Levels | 30,174,160 | 30,374,160 | 30,036,167 | 30,584,165 | 29,468,517 |
* GAA is General Appropriation Act.
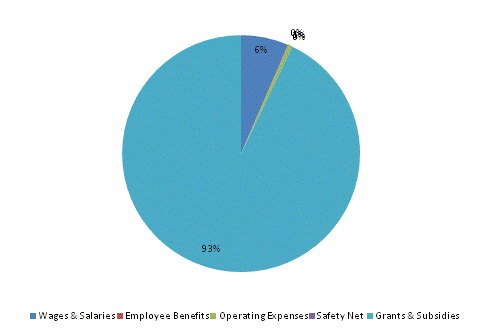
| SPENDING CATEGORY |
FY2013 Expended |
FY2014 Expended |
FY2015 Expended |
FY2016 Projected |
FY2017 GAA |
|---|---|---|---|---|---|
| Wages & Salaries | 2,065 | 2,076 | 1,877 | 1,949 | 1,904 |
| Employee Benefits | 18 | 15 | 22 | 28 | 27 |
| Operating Expenses | 113 | 182 | 118 | 143 | 161 |
| Safety Net | 0 | 0 | 0 | 6 | 6 |
| Grants & Subsidies | 27,917 | 27,792 | 27,613 | 28,459 | 27,370 |
| TOTAL | 30,113 | 30,064 | 29,629 | 30,584 | 29,469 |
FY2017 Spending Category Chart