|
FY2017 House 1 |
FY2017 House Final |
FY2017 Senate Final |
FY2017 GAA |
|
|---|---|---|---|---|
| Budget Tracking | 191,893,512 | 155,298,948 | 155,458,948 | 155,533,948 |
|
FY2014 GAA |
FY2015 GAA |
FY2016 GAA |
FY2016 Projected |
FY2017 GAA |
|
|---|---|---|---|---|---|
| Historical Budget Levels | 90,406,700 | 140,299,718 | 154,873,948 | 195,982,508 | 155,533,948 |
* GAA is General Appropriation Act.
| SPENDING CATEGORY |
FY2013 Expended |
FY2014 Expended |
FY2015 Expended |
FY2016 Projected |
FY2017 GAA |
|---|---|---|---|---|---|
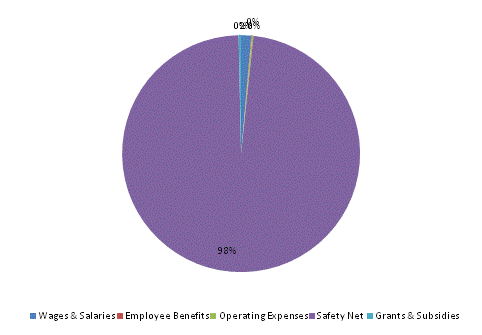
| Wages & Salaries | 2,250 | 3,486 | 4,543 | 2,625 | 2,142 |
| Employee Benefits | 137 | 169 | 137 | 175 | 142 |
| Operating Expenses | 275 | 251 | 349 | 394 | 319 |
| Safety Net | 85,755 | 120,680 | 185,856 | 192,149 | 152,412 |
| Grants & Subsidies | 950 | 863 | 914 | 640 | 519 |
| TOTAL | 89,366 | 125,450 | 191,800 | 195,983 | 155,534 |
FY2017 Spending Category Chart
