|
FY2017 House 1 |
FY2017 House Final |
FY2017 Senate Final |
FY2017 GAA |
|
|---|---|---|---|---|
| Budget Tracking | 9,147,473 | 9,147,474 | 9,147,474 | 9,147,474 |
|
FY2014 GAA |
FY2015 GAA |
FY2016 GAA |
FY2016 Projected |
FY2017 GAA |
|
|---|---|---|---|---|---|
| Historical Budget Levels | 8,497,163 | 8,978,876 | 9,183,473 | 8,668,376 | 9,147,474 |
* GAA is General Appropriation Act.
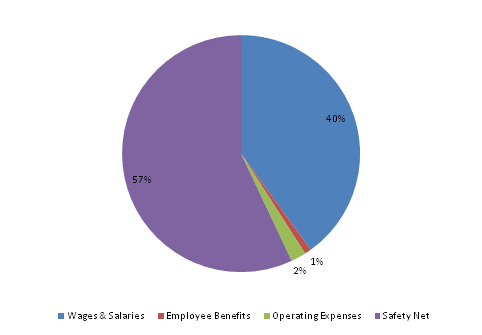
| SPENDING CATEGORY |
FY2013 Expended |
FY2014 Expended |
FY2015 Expended |
FY2016 Projected |
FY2017 GAA |
|---|---|---|---|---|---|
| Wages & Salaries | 3,231 | 3,310 | 3,102 | 3,205 | 3,661 |
| Employee Benefits | 62 | 71 | 72 | 84 | 82 |
| Operating Expenses | 188 | 188 | 191 | 191 | 191 |
| Safety Net | 4,745 | 4,656 | 4,860 | 5,189 | 5,214 |
| TOTAL | 8,226 | 8,225 | 8,225 | 8,668 | 9,147 |
FY2017 Spending Category Chart