|
FY2017 House 1 |
FY2017 House Final |
FY2017 Senate Final |
FY2017 GAA |
|
|---|---|---|---|---|
| Budget Tracking | 27,433,275 | 27,433,275 | 27,433,275 | 27,408,942 |
|
FY2014 GAA |
FY2015 GAA |
FY2016 GAA |
FY2016 Projected |
FY2017 GAA |
|
|---|---|---|---|---|---|
| Historical Budget Levels | 27,275,844 | 28,098,283 | 28,720,222 | 24,907,462 | 27,408,942 |
* GAA is General Appropriation Act.
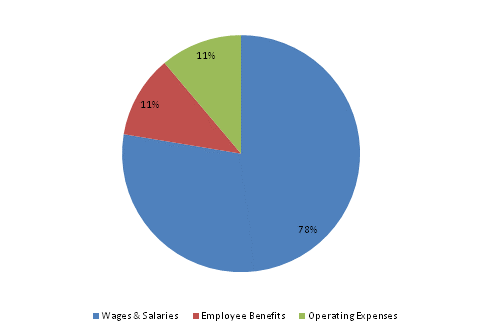
| SPENDING CATEGORY |
FY2013 Expended |
FY2014 Expended |
FY2015 Expended |
FY2016 Projected |
FY2017 GAA |
|---|---|---|---|---|---|
| Wages & Salaries | 19,239 | 21,107 | 21,425 | 18,741 | 21,272 |
| Employee Benefits | 3,989 | 3,018 | 3,048 | 3,182 | 3,079 |
| Operating Expenses | 3,287 | 2,886 | 3,007 | 2,984 | 3,058 |
| TOTAL | 26,515 | 27,010 | 27,479 | 24,907 | 27,409 |
FY2017 Spending Category Chart