|
FY2017 House 1 |
FY2017 House Final |
FY2017 Senate Final |
FY2017 GAA |
|
|---|---|---|---|---|
| Budget Tracking | 2,466,084 | 2,466,084 | 2,466,084 | 2,466,084 |
|
FY2014 GAA |
FY2015 GAA |
FY2016 GAA |
FY2016 Projected |
FY2017 GAA |
|
|---|---|---|---|---|---|
| Historical Budget Levels | 2,077,119 | 2,094,902 | 2,510,154 | 2,364,604 | 2,466,084 |
* GAA is General Appropriation Act.
| SPENDING CATEGORY |
FY2013 Expended |
FY2014 Expended |
FY2015 Expended |
FY2016 Projected |
FY2017 GAA |
|---|---|---|---|---|---|
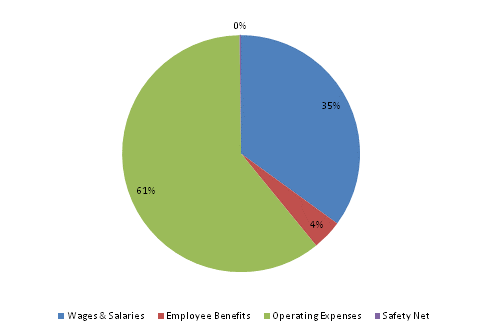
| Wages & Salaries | 639 | 677 | 734 | 763 | 863 |
| Employee Benefits | 92 | 93 | 101 | 100 | 101 |
| Operating Expenses | 1,291 | 1,280 | 1,202 | 1,497 | 1,497 |
| Safety Net | 14 | 5 | 5 | 5 | 5 |
| TOTAL | 2,036 | 2,056 | 2,042 | 2,365 | 2,466 |
FY2017 Spending Category Chart
