|
FY2017 House 1 |
FY2017 House Final |
FY2017 Senate Final |
FY2017 GAA |
|
|---|---|---|---|---|
| Budget Tracking | 12,282,647 | 12,282,648 | 12,282,648 | 12,282,648 |
|
FY2014 GAA |
FY2015 GAA |
FY2016 GAA |
FY2016 Projected |
FY2017 GAA |
|
|---|---|---|---|---|---|
| Historical Budget Levels | 12,364,668 | 14,145,385 | 12,848,230 | 11,568,728 | 12,282,648 |
* GAA is General Appropriation Act.
| SPENDING CATEGORY |
FY2013 Expended |
FY2014 Expended |
FY2015 Expended |
FY2016 Projected |
FY2017 GAA |
|---|---|---|---|---|---|
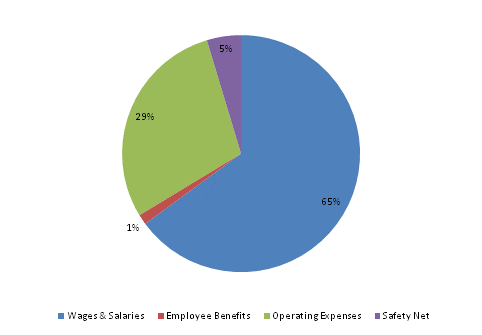
| Wages & Salaries | 7,073 | 7,139 | 8,148 | 7,266 | 7,977 |
| Employee Benefits | 100 | 113 | 163 | 165 | 170 |
| Operating Expenses | 3,911 | 3,987 | 3,288 | 3,439 | 3,563 |
| Safety Net | 828 | 980 | 836 | 569 | 573 |
| Debt Service | 0 | 0 | 0 | 130 | 0 |
| TOTAL | 11,912 | 12,219 | 12,435 | 11,569 | 12,283 |
FY2017 Spending Category Chart
