|
FY2017 House 1 |
FY2017 House Final |
FY2017 Senate Final |
FY2017 GAA |
|
|---|---|---|---|---|
| Budget Tracking | 3,599,010 | 3,749,010 | 3,879,010 | 3,929,010 |
|
FY2014 GAA |
FY2015 GAA |
FY2016 GAA |
FY2016 Projected |
FY2017 GAA |
|
|---|---|---|---|---|---|
| Historical Budget Levels | 3,278,133 | 3,892,377 | 3,437,386 | 3,785,651 | 3,929,010 |
* GAA is General Appropriation Act.
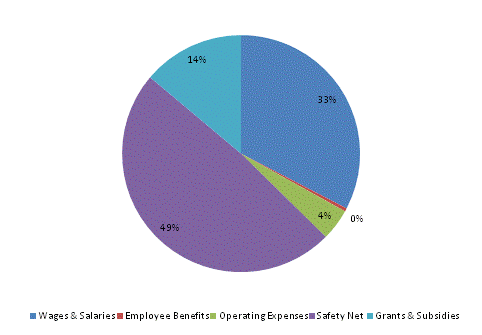
| SPENDING CATEGORY |
FY2013 Expended |
FY2014 Expended |
FY2015 Expended |
FY2016 Projected |
FY2017 GAA |
|---|---|---|---|---|---|
| Wages & Salaries | 1,166 | 918 | 962 | 1,196 | 1,281 |
| Employee Benefits | 5 | 7 | 14 | 16 | 18 |
| Operating Expenses | 113 | 115 | 139 | 155 | 169 |
| Safety Net | 2,019 | 2,091 | 1,895 | 1,919 | 1,915 |
| Grants & Subsidies | 101 | 135 | 383 | 500 | 546 |
| TOTAL | 3,405 | 3,266 | 3,393 | 3,786 | 3,929 |
FY2017 Spending Category Chart