|
FY2017 House 1 |
FY2017 House Final |
FY2017 Senate Final |
FY2017 GAA |
|
|---|---|---|---|---|
| Budget Tracking | 1,969,647 | 1,669,647 | 2,219,647 | 2,219,647 |
|
FY2014 GAA |
FY2015 GAA |
FY2016 GAA |
FY2016 Projected |
FY2017 GAA |
|
|---|---|---|---|---|---|
| Historical Budget Levels | 1,474,040 | 2,028,397 | 1,736,188 | 1,961,895 | 2,219,647 |
* GAA is General Appropriation Act.
| SPENDING CATEGORY |
FY2013 Expended |
FY2014 Expended |
FY2015 Expended |
FY2016 Projected |
FY2017 GAA |
|---|---|---|---|---|---|
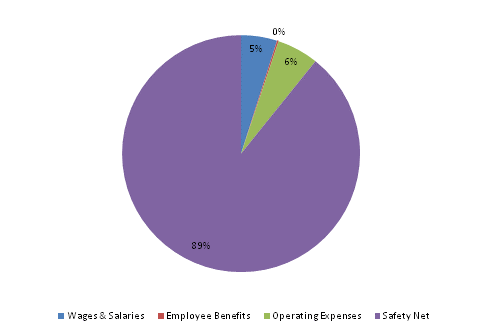
| Wages & Salaries | 141 | 139 | 128 | 97 | 109 |
| Employee Benefits | 6 | 4 | 2 | 4 | 5 |
| Operating Expenses | 101 | 106 | 104 | 121 | 125 |
| Safety Net | 1,151 | 1,210 | 1,760 | 1,739 | 1,980 |
| TOTAL | 1,399 | 1,458 | 1,994 | 1,962 | 2,220 |
FY2017 Spending Category Chart
