|
FY2017 House 1 |
FY2017 House Final |
FY2017 Senate Final |
FY2017 GAA |
|
|---|---|---|---|---|
| Budget Tracking | 4,450,449 | 4,450,449 | 4,630,449 | 4,630,449 |
|
FY2014 GAA |
FY2015 GAA |
FY2016 GAA |
FY2016 Projected |
FY2017 GAA |
|
|---|---|---|---|---|---|
| Historical Budget Levels | 3,165,665 | 3,754,426 | 3,869,814 | 4,308,669 | 4,630,449 |
* GAA is General Appropriation Act.
| SPENDING CATEGORY |
FY2013 Expended |
FY2014 Expended |
FY2015 Expended |
FY2016 Projected |
FY2017 GAA |
|---|---|---|---|---|---|
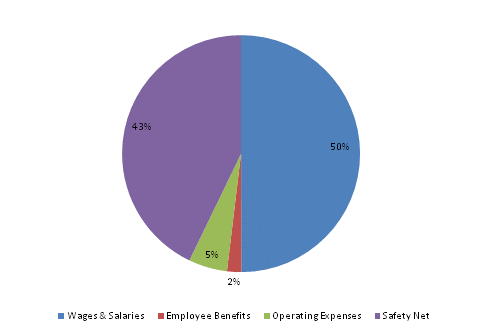
| Wages & Salaries | 1,316 | 1,260 | 1,661 | 2,107 | 2,313 |
| Employee Benefits | 45 | 51 | 61 | 85 | 90 |
| Operating Expenses | 52 | 43 | 62 | 211 | 244 |
| Safety Net | 1,655 | 1,748 | 1,816 | 1,906 | 1,983 |
| TOTAL | 3,068 | 3,102 | 3,600 | 4,309 | 4,630 |
FY2017 Spending Category Chart
