|
FY2017 House 1 |
FY2017 House Final |
FY2017 Senate Final |
FY2017 GAA |
|
|---|---|---|---|---|
| Budget Tracking | 2,128,303 | 2,128,303 | 2,128,302 | 2,128,302 |
|
FY2014 GAA |
FY2015 GAA |
FY2016 GAA |
FY2016 Projected |
FY2017 GAA |
|
|---|---|---|---|---|---|
| Historical Budget Levels | 2,481,081 | 2,631,081 | 2,547,181 | 2,054,303 | 2,128,302 |
* GAA is General Appropriation Act.
| SPENDING CATEGORY |
FY2013 Expended |
FY2014 Expended |
FY2015 Expended |
FY2016 Projected |
FY2017 GAA |
|---|---|---|---|---|---|
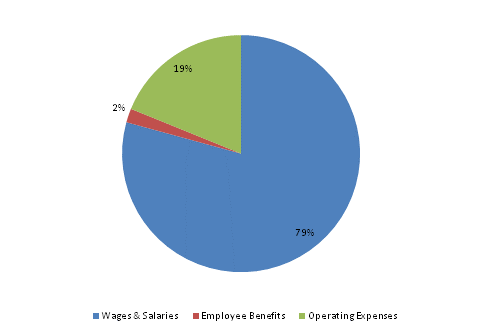
| Wages & Salaries | 1,855 | 1,901 | 1,857 | 1,553 | 1,687 |
| Employee Benefits | 39 | 38 | 43 | 39 | 40 |
| Operating Expenses | 397 | 299 | 486 | 462 | 401 |
| Grants & Subsidies | 39 | 0 | 0 | 0 | 0 |
| TOTAL | 2,329 | 2,238 | 2,386 | 2,054 | 2,128 |
FY2017 Spending Category Chart
