|
FY2017 House 1 |
FY2017 House Final |
FY2017 Senate Final |
FY2017 GAA |
|
|---|---|---|---|---|
| Budget Tracking | 4,833,199 | 3,961,554 | 3,913,554 | 3,938,554 |
|
FY2014 GAA |
FY2015 GAA |
FY2016 GAA |
FY2016 Projected |
FY2017 GAA |
|
|---|---|---|---|---|---|
| Historical Budget Levels | 4,516,414 | 4,432,349 | 4,227,791 | 3,541,307 | 3,938,554 |
* GAA is General Appropriation Act.
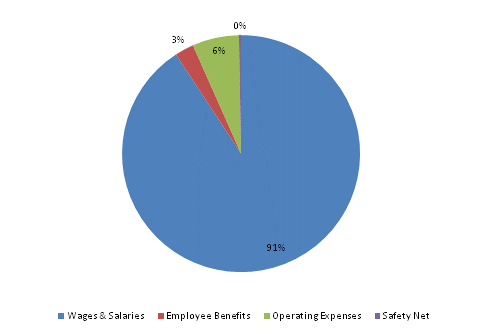
| SPENDING CATEGORY |
FY2013 Expended |
FY2014 Expended |
FY2015 Expended |
FY2016 Projected |
FY2017 GAA |
|---|---|---|---|---|---|
| Wages & Salaries | 3,178 | 3,674 | 4,147 | 3,293 | 3,574 |
| Employee Benefits | 66 | 92 | 106 | 102 | 103 |
| Operating Expenses | 68 | 224 | 61 | 132 | 250 |
| Safety Net | 5 | 6 | 12 | 14 | 12 |
| TOTAL | 3,317 | 3,996 | 4,326 | 3,541 | 3,939 |
FY2017 Spending Category Chart