|
FY2017 House 1 |
FY2017 House Final |
FY2017 Senate Final |
FY2017 GAA |
|
|---|---|---|---|---|
| Budget Tracking | 3,380,006 | 3,375,571 | 3,375,571 | 3,026,983 |
|
FY2014 GAA |
FY2015 GAA |
FY2016 GAA |
FY2016 Projected |
FY2017 GAA |
|
|---|---|---|---|---|---|
| Historical Budget Levels | 2,910,728 | 2,971,883 | 3,190,535 | 2,882,379 | 3,026,983 |
* GAA is General Appropriation Act.
| SPENDING CATEGORY |
FY2013 Expended |
FY2014 Expended |
FY2015 Expended |
FY2016 Projected |
FY2017 GAA |
|---|---|---|---|---|---|
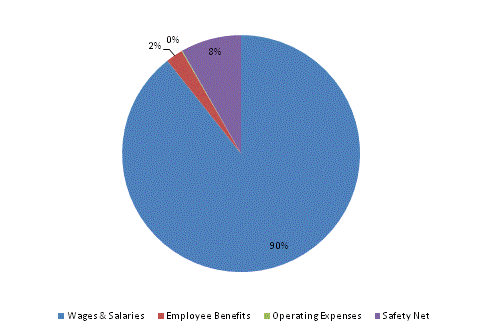
| Wages & Salaries | 1,498 | 1,880 | 2,062 | 2,574 | 2,704 |
| Employee Benefits | 22 | 32 | 57 | 58 | 70 |
| Operating Expenses | 1,298 | 614 | 618 | 0 | 3 |
| Safety Net | 250 | 250 | 250 | 250 | 250 |
| TOTAL | 3,068 | 2,776 | 2,987 | 2,882 | 3,027 |
FY2017 Spending Category Chart
