|
FY2017 House 1 |
FY2017 House Final |
FY2017 Senate Final |
FY2017 GAA |
|
|---|---|---|---|---|
| Budget Tracking | 4,313,482 | 4,313,482 | 4,444,938 | 4,313,482 |
|
FY2014 GAA |
FY2015 GAA |
FY2016 GAA |
FY2016 Projected |
FY2017 GAA |
|
|---|---|---|---|---|---|
| Historical Budget Levels | 4,280,684 | 4,280,684 | 4,306,174 | 4,252,417 | 4,313,482 |
* GAA is General Appropriation Act.
| SPENDING CATEGORY |
FY2013 Expended |
FY2014 Expended |
FY2015 Expended |
FY2016 Projected |
FY2017 GAA |
|---|---|---|---|---|---|
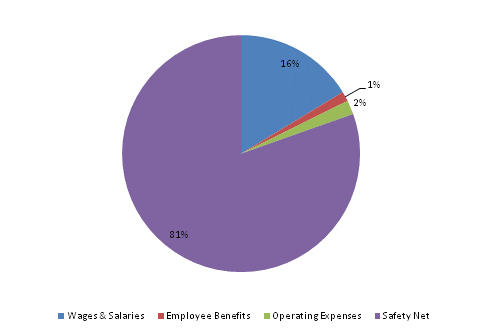
| Wages & Salaries | 667 | 696 | 742 | 679 | 705 |
| Employee Benefits | 55 | 52 | 54 | 57 | 57 |
| Operating Expenses | 90 | 84 | 84 | 83 | 83 |
| Safety Net | 3,457 | 3,350 | 3,363 | 3,434 | 3,468 |
| TOTAL | 4,270 | 4,182 | 4,242 | 4,252 | 4,313 |
FY2017 Spending Category Chart
