|
FY2017 House 1 |
FY2017 House Final |
FY2017 Senate Final |
FY2017 GAA |
|
|---|---|---|---|---|
| Budget Tracking | 1,368,933 | 1,368,934 | 1,368,934 | 1,368,934 |
|
FY2014 GAA |
FY2015 GAA |
FY2016 GAA |
FY2016 Projected |
FY2017 GAA |
|
|---|---|---|---|---|---|
| Historical Budget Levels | 1,361,524 | 1,382,207 | 1,486,228 | 1,362,373 | 1,368,934 |
* GAA is General Appropriation Act.
| SPENDING CATEGORY |
FY2013 Expended |
FY2014 Expended |
FY2015 Expended |
FY2016 Projected |
FY2017 GAA |
|---|---|---|---|---|---|
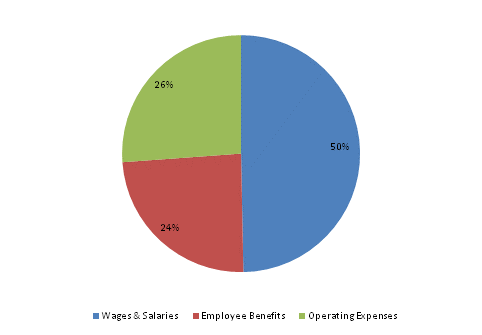
| Wages & Salaries | 646 | 659 | 648 | 660 | 680 |
| Employee Benefits | 370 | 361 | 338 | 341 | 331 |
| Operating Expenses | 321 | 323 | 346 | 358 | 358 |
| Debt Service | 0 | 0 | 0 | 3 | 0 |
| TOTAL | 1,337 | 1,343 | 1,332 | 1,362 | 1,369 |
FY2017 Spending Category Chart
