|
FY2017 House 1 |
FY2017 House Final |
FY2017 Senate Final |
FY2017 GAA |
|
|---|---|---|---|---|
| Budget Tracking | 2,425,838,433 | 2,435,238,433 | 2,427,438,433 | 2,377,838,433 |
|
FY2014 GAA |
FY2015 GAA |
FY2016 GAA |
FY2016 Projected |
FY2017 GAA |
|
|---|---|---|---|---|---|
| Historical Budget Levels | 2,196,315,039 | 2,381,458,986 | 2,489,792,092 | 2,530,834,668 | 2,377,838,433 |
* GAA is General Appropriation Act.
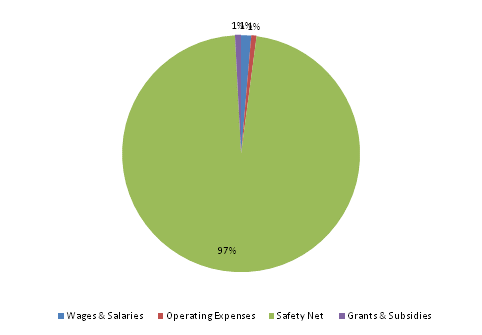
| SPENDING CATEGORY |
FY2013 Expended |
FY2014 Expended |
FY2015 Expended |
FY2016 Projected |
FY2017 GAA |
|---|---|---|---|---|---|
| Wages & Salaries | 11,772 | 15,222 | 17,144 | 15,242 | 32,599 |
| Employee Benefits | 1 | 45 | 0 | 0 | 0 |
| Operating Expenses | 9,640 | 13,652 | 10,426 | 19,127 | 17,133 |
| Safety Net | 1,884,952 | 2,090,591 | 2,390,287 | 2,476,465 | 2,308,503 |
| Grants & Subsidies | 0 | 37,500 | 0 | 20,000 | 19,604 |
| TOTAL | 1,906,365 | 2,157,010 | 2,417,856 | 2,530,835 | 2,377,838 |
FY2017 Spending Category Chart