|
FY2017 House 1 |
FY2017 House Final |
FY2017 Senate Final |
FY2017 GAA |
|
|---|---|---|---|---|
| Budget Tracking | 14,864,184 | 14,864,184 | 14,988,947 | 14,864,184 |
|
FY2014 GAA |
FY2015 GAA |
FY2016 GAA |
FY2016 Projected |
FY2017 GAA |
|
|---|---|---|---|---|---|
| Historical Budget Levels | 11,666,532 | 14,311,692 | 15,268,483 | 15,268,994 | 14,864,184 |
* GAA is General Appropriation Act.
| SPENDING CATEGORY |
FY2013 Expended |
FY2014 Expended |
FY2015 Expended |
FY2016 Projected |
FY2017 GAA |
|---|---|---|---|---|---|
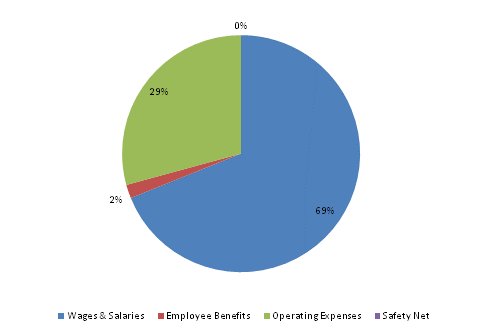
| Wages & Salaries | 7,772 | 7,974 | 8,683 | 9,770 | 10,245 |
| Employee Benefits | 131 | 157 | 232 | 263 | 273 |
| Operating Expenses | 2,733 | 3,341 | 4,936 | 5,235 | 4,345 |
| Safety Net | 0 | 0 | 0 | 2 | 2 |
| TOTAL | 10,636 | 11,472 | 13,852 | 15,269 | 14,864 |
FY2017 Spending Category Chart
