|
FY2017 House 1 |
FY2017 House Final |
FY2017 Senate Final |
FY2017 GAA |
|
|---|---|---|---|---|
| Budget Tracking | 25,000 | 25,000 | 25,000 | 25,000 |
|
FY2014 GAA |
FY2015 GAA |
FY2016 GAA |
FY2016 Projected |
FY2017 GAA |
|
|---|---|---|---|---|---|
| Historical Budget Levels | 55,000 | 55,000 | 25,000 | 1,700 | 25,000 |
* GAA is General Appropriation Act.
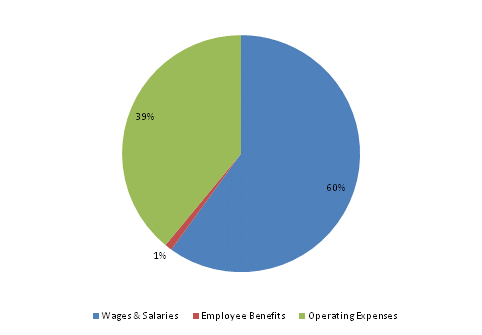
| SPENDING CATEGORY |
FY2013 Expended |
FY2014 Expended |
FY2015 Expended |
FY2016 Projected |
FY2017 GAA |
|---|---|---|---|---|---|
| Wages & Salaries | 11 | 0 | 16 | -8 | 15 |
| Employee Benefits | 0 | 0 | 0 | 0 | 0 |
| Operating Expenses | 13 | 12 | 2 | 10 | 10 |
| TOTAL | 24 | 12 | 18 | 2 | 25 |
FY2017 Spending Category Chart